2026 oil & gas storylines
- Oil prices have stayed relatively firm into early 2026, supported by OPEC+ supply management, geopolitical tension, and resilient global demand.
- The United States Oil Fund (USO) reported “strong” January 2026 results, with total income around 143 million dollars and NAV up to roughly 1.0 billion dollars, reflecting profitable long oil futures exposure.
- Oil & gas equipment and services have staged a sharp rebound: the XES ETF is up about 13–14% so far in the FY2026 period after a very weak FY2025, a typical late‑cycle catch‑up move when producers increase capex.
- Exploration & production (XOP) and spot‑oil exposure (USO) show positive but more moderate gains, tracking the underlying oil price and producer earnings rather than the more cyclical services segment.
- Gas remains more volatile and weather‑sensitive than oil; UNG (spot gas) often swings harder than crude‑linked products, and 2026 remains shaped by LNG export growth, storage levels, and winter/summer temperature surprises.
How each ETF maps to the value chain
Think of the oil & gas chain as: find it → drill it → move it → sell/consume it, with separate “price‑only” tools (USO, UNG) for pure commodity bets.
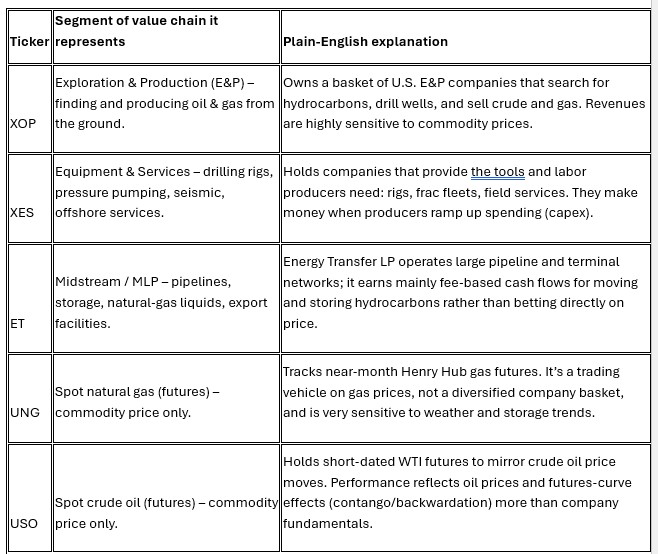
Put simply:
- XOP = oil & gas producers
- XES = service providers to those producers
- ET = pipelines & infrastructure
- UNG, USO = pure price bets on gas and oil
2026 performance tone, by sleeve
XES – equipment & services (higher‑beta recovery)
- In FY2026 so far, XES is up around 13–14%, after a roughly 30% drop in FY2025, showing a sharp rebound from a low base.
- A recent note pegs XES up about 36% year‑to‑date and over 47% over the last 12 months (to late February 2026), highlighting how violently the services space can move once spending comes back.
Takeaway: services are the “turbo‑charged” part of the sector. When producers feel better, they order rigs and frac crews, and XES can move faster than the broader energy complex—but that also cuts both ways in downturns.
XOP – exploration & production (direct oil & gas leverage)
- XOP tracks S&P Oil & Gas Exploration & Production names and is trading in the low‑to‑mid‑100s with a dividend yield near the mid‑2% range and a mid‑teens P/E, reflecting healthy but not euphoric conditions.
- E&Ps have been returning more cash via dividends and buybacks instead of chasing aggressive production growth, which can moderate volatility compared with past cycles.
Takeaway: XOP is a balanced way to own “oil & gas producers” in 2026—still cyclical, but supported by shareholder‑return discipline rather than pure volume chasing.
USO – crude‑price barometer
- USO’s NAV climbed to about 1.02 billion dollars with positive returns over the last year, and January 2026 was described as “strong performance,” reflecting profitable exposure to higher crude prices.tipranks+2
- Rolling futures means USO’s result depends on both the spot oil move and the shape of the futures curve; backwardation has been supportive, while contango would be a drag.
Takeaway: USO is a trading instrument on oil, not a long‑term “own the energy sector” solution—best used when you have a clear view on near‑term crude direction.
UNG – natural gas volatility tool
- While specific 2026 numbers aren’t in the snippets above, UNG historically moves more dramatically than oil funds because gas prices are driven by weather, storage, and LNG exports rather than global OPEC policy.
Takeaway: UNG is for investors comfortable with big swings and tight risk controls; it’s more akin to a short‑term trade than a core holding.
ET – midstream ballast
- Energy Transfer’s business model is fee‑based midstream: gathering, processing, pipelines, storage, and export terminals. Cash flows tend to be steadier than producers’ because many contracts are volume‑based rather than price‑based.
- As an MLP, ET often offers a high cash distribution, making it attractive for income‑oriented investors within energy.
Takeaway: ET can act as a steadier, income‑oriented anchor next to higher‑beta holdings like XOP and XES.