General Commodities
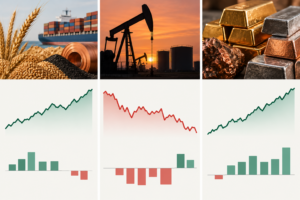
The ETF commodities market was mixed overall, with strength concentrated in metals while energy and agriculture lagged. Broad natural-resource ETFs were generally positive, with the group gaining roughly 0.5% on average and recording approximately $10.7 million in daily net inflows. Physical commodity products also moved higher, while agriculture ETFs were modestly weaker. Overall, the session showed a rotation away from energy-related exposure and toward metals and broader natural-resource strategies.
Oil & Gas
Oil and gas ETFs were mostly lower on the day, reflecting weakness across crude oil and energy equities. XOP declined about 1.7%, USO fell 2.8%, and BNO dropped 1.6%, while the broader energy-sector ETF group lost roughly 1% on average. Natural gas was the major exception: UNG gained 5.8% and leveraged BOIL surged 11.1%. Oil & gas products collectively saw approximately $81.6 million in daily net outflows, pointing to weaker investor demand for the sector despite strength in natural gas.
Metals
Metals were the strongest area of the commodities ETF market, with gains across precious metals, industrial metals, and mining equities. Precious-metals ETFs rose about 1.6% on average, while industrial-metals products gained roughly 1.1%. Mining equities performed even better, with base-metal miners gaining about 2.3% and precious-metal miners advancing approximately 2.7% on average. GDXJ rose more than 4%, while copper-focused CPER gained about 1.9%. Despite the positive price action, precious-metals ETFs recorded roughly $143 million in daily net outflows, suggesting investor flows remained cautious even as the sector rallied.
General Commodities
Commodities traded with a mixed tone heading into September 23, with a stronger U.S. dollar creating pressure across metals while energy markets attempted to stabilize. Broader markets were also slightly weaker in pre-market trading, with S&P 500 futures down 0.2% and Dow futures down 0.3%. Attention remains on shifting global energy supply conditions, U.S. economic data, and upcoming inventory reports as key drivers for commodity prices.
Oil & Gas
Oil prices were attempting to break a five-day losing streak, with WTI up 0.1% to $90.65 and Brent up 0.9%, as markets assessed higher global supplies and the resumption of Saudi oil loadings from the Yanbu terminal. API data showed U.S. crude inventories increasing by 1.786 million barrels, while gasoline and distillate inventories declined. Natural gas gained 2.5% to $3.04, supported by lower U.S. production and forecasts for above-normal temperatures across much of the country.
- Oil & Gas:
- Pricing
- WTI +0.1% to $90.65 (Nov)
- Brent +0.9% to $9100.17 (Nov)
- Natural gas +2.5% to $3.040 (Oct)
- RBOB +2.0% to $3.557 (Oct)
- ULSD (0.1%) to $4.939 (Oct)
- Pricing
Metals
Metals were mostly lower in pre-market trading as the U.S. dollar strengthened. Gold declined 0.9% to $4,337.30/oz, silver fell 1.7% to $65.41/oz, and copper slipped 0.5% to $6.80/lb. Aluminum and zinc were also lower, while nickel gained 1.8%. Despite the daily weakness, copper remained up nearly 20% year-to-date, while gold and silver continued to experience pressure following their recent pullbacks.
- Metals Pricing:
- Gold (0.89)% to $4337.3/oz, Monthly (7.33)%, YTD (0.09)%:
- Silver (1.68)% to $65.41/oz, Monthly (5.93)%, YTD (7.36)%:
- Copper (0.5)% to $6.802/lb, Monthly +3.26%, YTD +19.71%:
- Aluminum (0.63)% to $3242/mt, Monthly +0%, YTD +0%:
- Nickel +1.77% to $16410/mt, Monthly +0%, YTD +0%:
- Zinc (0.3)% to $4006/mt, Monthly +0%, YTD +0%:
- VanEck Gold Miners ETF +0% to $97.83, Monthly (4.86)%, YTD +14.06%:
- VanEck Junior Gold Miners ETF +0% to $127.97, Monthly (3.48)%, YTD +12.47%:
- US Dollar +0.3% to $100.901, Monthly +2.13%, YTD +2.62%:
- CBOE Volatility Index +0.57% to $17.46, Monthly (0.24)%, YTD +5.61%: